Advanced Data Analysis: Harnessing PivotTables and PivotCharts in MS Excel 2013
Introduction:
In the realm of data analysis, Microsoft Excel 2013 stands out as a powerhouse, and at the heart of its analytical prowess are PivotTables and PivotCharts. This comprehensive article aims to guide users through the advanced features and functionalities of PivotTables and PivotCharts in MS Excel 2013. From transforming raw data into meaningful insights to creating dynamic visualizations, users will embark on a journey to harness the full potential of these tools for advanced data analysis.
I. Unlocking the Power of PivotTables:
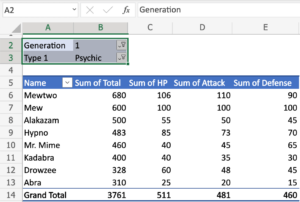
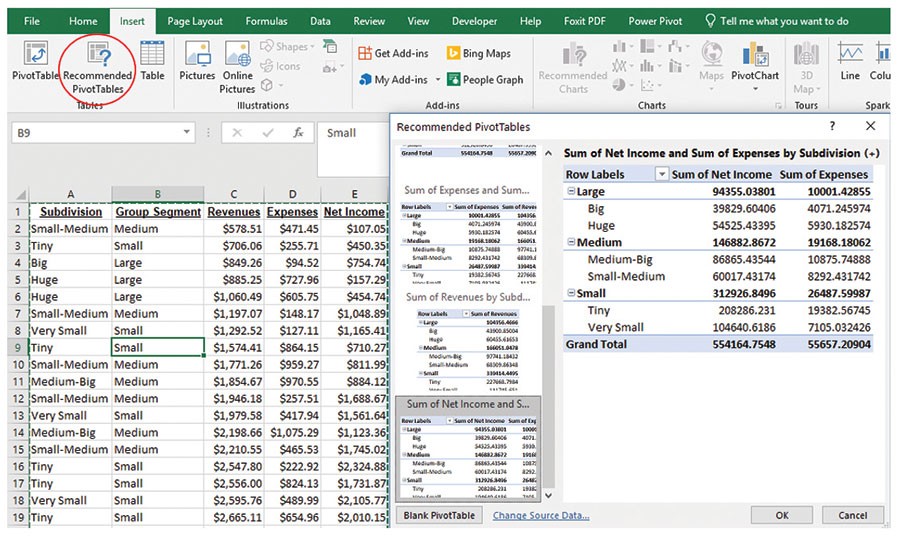
A. Understanding PivotTables: Delve into the basics of PivotTables, exploring how they enable users to summarize and analyze large datasets with ease. Learn how to set up a PivotTable, define rows and columns, and select the data source to kickstart your advanced data analysis journey.
B. Data Field Options: Uncover the various options available for data fields within PivotTables. From summing and counting to averaging and finding the minimum or maximum values, understand how to tailor your PivotTable to extract specific insights from your dataset.
C. Grouping and Slicing Data: Explore advanced techniques such as grouping data based on date or categorical values. Learn how to create hierarchies within your PivotTable, allowing for a more granular analysis. Additionally, master the art of slicing data to focus on specific subsets, enhancing the depth of your analysis.
II. Advanced PivotTable Features:
A. Calculated Fields and Items: Dive into the world of calculated fields and items, empowering users to perform custom calculations within PivotTables. Understand how to create calculated fields for on-the-fly computations and introduce calculated items for additional analysis flexibility.
B. Sorting and Filtering: Learn advanced sorting and filtering techniques to tailor your PivotTable results. From custom sorts to complex filters, discover how to manipulate your data dynamically, allowing for a more nuanced analysis of trends and patterns.
C. Timeline and Data Models: Explore the introduction of timelines and data models in Excel 2013. Understand how timelines enhance date-based analysis within PivotTables, while data models enable the consolidation of multiple tables for a more comprehensive analytical approach.
III. Dynamic Visualizations with PivotCharts:
A. Creating PivotCharts: Transition from data tables to dynamic visualizations with PivotCharts. Explore the process of creating various chart types directly linked to your PivotTable, providing a visual representation of your data’s trends and outliers.
B. Customizing PivotCharts: Delve into the customization options available for PivotCharts. From formatting to adding trendlines and annotations, learn how to tailor your visualizations to effectively communicate your data-driven insights to stakeholders.
C. Slicer Integration: Uncover the synergy between PivotCharts and slicers, enabling users to dynamically filter data in both tables and charts simultaneously. Master the art of creating interactive dashboards by combining PivotTables, PivotCharts, and slicers for a seamless analytical experience.
IV. Best Practices for Advanced Data Analysis:
A. Optimizing Performance: Understand best practices to optimize the performance of PivotTables and PivotCharts, especially when dealing with large datasets. Learn techniques to speed up calculations and maintain responsiveness during complex analyses.
B. Refreshing Data and Maintaining Accuracy: Explore the importance of data refresh and learn how to ensure the accuracy of your analyses as data sources evolve. Discover strategies for maintaining the integrity of your PivotTables and PivotCharts over time.
Conclusion:
As we conclude this exploration into advanced data analysis with PivotTables and PivotCharts in MS Excel 2013, users are equipped with the knowledge to transform raw data into actionable insights. Whether unraveling complex datasets, creating dynamic visualizations, or building interactive dashboards, the advanced features of Excel 2013 provide a robust toolkit for data analysts and professionals alike. By mastering the intricacies of PivotTables and PivotCharts, users can elevate their data analysis capabilities, enabling more informed decision-making and strategic planning in the ever-evolving landscape of data-driven insights.