Data Visualization Brilliance: Excel Integration in PowerPoint 2016
Introduction
In the realm of business presentations and data-driven communication, the synergy between Microsoft Excel and PowerPoint 2016 is a game-changer. The integration of Excel in PowerPoint empowers presenters to elevate their data visualization strategies, creating compelling and insightful presentations. This comprehensive guide, titled “Data Visualization Brilliance: Unleashing the Power of Excel Integration in PowerPoint 2016,” delves into the intricacies of Excel integration, unraveling its features, benefits, and the transformative impact it has on presenting data with precision. From understanding the integration process to practical applications, this guide aims to empower presenters with the knowledge needed to harness the full potential of Excel Integration in PowerPoint 2016.
Understanding Excel Integration: A Dynamic Duo for Data Presentation
The integration of Excel in PowerPoint 2016 allows presenters to embed Excel worksheets or charts directly into PowerPoint slides. This integration brings the robust data manipulation and analysis capabilities of Excel seamlessly into the visual storytelling canvas of PowerPoint. Whether presenting financial data, performance metrics, or trends, Excel integration provides a dynamic and interactive approach to data visualization.
Key Features of Excel Integration:
- Live Data Updates: Embedded Excel charts in PowerPoint are linked to the original Excel file. This means that any changes made to the data in Excel are automatically reflected in the PowerPoint presentation. Live data updates ensure that presentations remain accurate and up-to-date.
- Dynamic Chart Interactivity: Embedded Excel charts retain their interactivity within PowerPoint. This allows presenters to interact with the charts during a presentation, such as highlighting specific data points or switching between chart views directly in PowerPoint.
- Seamless Editing: Presenters can seamlessly edit embedded Excel content from within PowerPoint. Double-clicking on an embedded chart opens the Excel interface, enabling real-time adjustments to the data, chart type, formatting, and more.
- Chart Animation: PowerPoint 2016 offers built-in animations for embedded Excel charts. This feature allows presenters to add dynamic transitions and animations to charts, enhancing the visual appeal of data presentations.
- Data Labels and Annotations: Excel integration enables the use of data labels and annotations directly within PowerPoint. Presenters can add context to data points or provide explanations without the need to switch between applications.
Embedding Excel Content in PowerPoint 2016: A Step-by-Step Guide
To embed Excel content in PowerPoint 2016, follow these steps:
- Open PowerPoint: Launch Microsoft PowerPoint 2016 and open the presentation where you want to embed Excel content.
- Access the Insert Tab: Navigate to the “Insert” tab on the Ribbon.
- Embed Excel Chart: Click on the “Object” button in the Text group. In the Object dialog box, select “Create from file” and browse to locate the Excel file. Check the “Link” option if you want the content to be linked to the original Excel file for live updates.
- Insert Excel Chart: Alternatively, to insert only an Excel chart without linking to the original file, click on the “Chart” option in the Insert tab. Choose the desired chart type, input the data, and click “OK.”
- Adjust Size and Position: Resize and reposition the embedded Excel content on the PowerPoint slide as needed. This can be done by dragging the corners or edges of the embedded content.
- Update Linked Content: If the Excel content is linked, right-click on the embedded object and choose “Update Link” to synchronize any changes made in the original Excel file.
Benefits of Excel Integration: Elevating Data Presentation
The integration of Excel in PowerPoint 2016 offers a host of benefits, transforming data presentations into dynamic and impactful experiences:
- Live Data Accuracy: By linking Excel content to PowerPoint, presenters ensure that data is always up-to-date. Any modifications made to the original Excel file are reflected instantly in the PowerPoint presentation, eliminating the risk of presenting outdated information.
- Enhanced Interactivity: Embedded Excel charts maintain their interactivity within PowerPoint. Presenters can engage with the data during a presentation, zooming in on specific details, switching between chart views, and highlighting key points dynamically.
- Streamlined Editing Workflow: Seamless editing within PowerPoint simplifies the workflow for presenters. There’s no need to switch between applications; adjustments to data, formatting, or chart types can be made directly in PowerPoint.
- Visual Consistency: Excel integration ensures visual consistency across presentations. By embedding Excel charts, presenters can maintain a standardized visual style, making it easier for the audience to interpret and understand the data.
- Efficient Data Labeling: The use of data labels and annotations directly within PowerPoint streamlines the process of providing context to data points. Presenters can enhance the clarity of their data without relying solely on Excel.
Practical Applications: Excel Integration in Action
Excel integration finds practical applications across various presentation scenarios, enhancing the data visualization capabilities of presenters:
- Financial Reports: For financial presentations, linking Excel spreadsheets allows presenters to display live financial data in PowerPoint. Changes to revenue figures, expenses, or profit margins are instantly reflected in the presentation.
- Sales Performance Dashboards: Presenters can create dynamic sales performance dashboards by embedding Excel charts directly into PowerPoint. This allows for interactive presentations, where sales trends, targets, and achievements can be explored in real-time.
- Project Management Updates: Project managers can utilize Excel integration to showcase project timelines, task progress, and resource allocation directly within PowerPoint. Live updates ensure that stakeholders are presented with the latest project information.
- Market Trends and Analysis: Embedding Excel charts displaying market trends, growth rates, or competitor analysis adds depth to market-focused presentations. Real-time updates allow presenters to incorporate the latest market data.
- Scientific Research Findings: Researchers and scientists can present their findings dynamically by embedding Excel charts in PowerPoint. This integration facilitates interactive discussions around data points, trends, and conclusions.
Advanced Tips for Excel Integration Mastery
To master Excel integration in PowerPoint 2016, consider these advanced tips:
- Multiple Chart Views: Excel integration allows presenters to create multiple views of the same chart in PowerPoint. This is useful for comparing different scenarios or presenting data from various perspectives without cluttering a single chart.
- Data Label Customization: Customize data labels in Excel before embedding charts in PowerPoint. Excel offers extensive options for data label customization, allowing presenters to display specific information or format labels for clarity.
- Combining Excel Objects: Combine multiple Excel objects in PowerPoint to create comprehensive dashboards or reports. This can be done by embedding different charts, tables, or ranges of data on a single slide to provide a holistic view.
- Use of Excel Templates: Create Excel templates with predefined styles, formatting, and chart types. Embedding these templates in PowerPoint ensures a consistent visual theme across presentations.
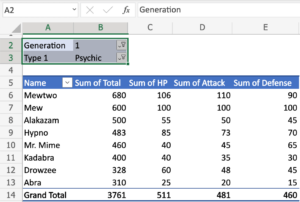
- Embedding Dynamic Tables: Instead of only embedding charts, consider embedding dynamic tables from Excel. This is especially useful for presenting detailed data sets or facilitating discussions around specific data points.
Conclusion
In the evolving landscape of business presentations, where data-driven insights play a pivotal role, the integration of Excel in PowerPoint 2016 stands as a beacon for presenters seeking to elevate their data visualization strategies. This integration is not merely a technical feature; it is a gateway to a dynamic and interactive approach to presenting data.
As presenters navigate the complexities of data communication, Excel integration becomes the bridge that connects the analytical depth of Excel with the visual storytelling prowess of PowerPoint. It transforms static presentations into living narratives, where data comes to life, engages the audience, and contributes to informed decision-making.
In the hands of a skilled presenter, Excel integration isn’t just a tool; it’s the key to unlocking the brilliance of data visualization in PowerPoint 2016. It empowers presenters to go beyond static charts and tables, creating presentations that are not only informative but also dynamic, insightful, and visually compelling. With Excel integration, data isn’t just presented; it’s visualized, understood, and remembered.